
More On Interferometry

INTERFERENCE
[Interference is explained in general terms in the accompanying blog, “Interferometry -Fringes and Phases.” If you have not read that article yet, you may want to start there.]
The wave-like behavior of photons leads to interference between two wavefronts which may be constructive or destructive. Usually that interference is partial; there is not total destruction or canceling, nor doubling of intensity for constructive interference. The result is a pattern of lighter and darker regions. This pattern often presents itself as lines (straight or arcs) or as closed circles. In some cases they may be irregular, even jagged.
Phase Contrast
Fringes are also called light bands. They are alternating lines or regions of dark and light formed by imaging the interference pattern from a reference surface and an optic being tested. They are analogous to contour lines on a topographical map. Each dark fringe is a focus of points for an equal optical path difference between that highly accurate reference and a (generally) distorted test wavefront. These darker points are the result of destructive interference.
Dark fringes are most obvious to the eye, which is sensitive to contrast but not so much to intensity. Hence, it appears that there are wide bands of light between dark fringes, because of partial destructive interference between the brightest bands where photons are exactly in phase.
It is uncommon that wavefronts interfering will be exactly the same intensity, though a minor mismatch will still be perceived as dark and light lines. Detectors used for imaging interference patterns can discern the slight variation in intensity between the darkest and brightest areas. The human eye, and some cameras or other detectors, will interpret the dimmer areas as dark even though there is not total destructive interference.

Fig. 1 The lower two red lines show equal intensity wavefronts perfectly in phase. They interfere to be a single wavefront with highs and lows exactly double those, as shown in the top red line.
Why do interference patterns form?
Two wavefronts, coherent bundles of photons, may be combined in an imaging plane. This could be a screen, a camera, CCD array, film, even the retina of the eye. If they are exactly the same wavelength (reciprocal of the frequency) they will interfere. If they are exactly in phase they will combine additively, which is called constructive interference. If one wavefront is out of phase by a little bit, they will still add, but the intensity won’t be as great. If precisely out of phase by a half wave (180 degrees) they will interfere destructively, and the intensity will be reduced to a minimum. Seldom are the two wavefronts of identical intensity, so the destructive interference is not total. Yet the pattern of greater and lesser intensity still allows evaluation by appropriate sensors.
The relative difference in distance the two wavefronts travel will determine if they are primarily in or out of phase. Because the wave property of photons is sinusoidal, the phase difference repeats every wavelength of distance difference. With test plates or the most common interferometers, the optical path difference is double the physical and internal optical distortion. This scale factor is calculated in the analysis of the wavefront. For traditional test plate fringe patterns, this is responsible for the half-wave-per-fringe-spacing convention. For each additional wavelength of travel, the interference pattern repeats.
There are many configurations of interferometers. The ones used most commonly to evaluate wavefronts are the Fizeau and the Twyman Green versions. These both utilize a double pass on the test leg of the interferometer. On the other hand, a Mach Zehnder interferometer makes only a single pass of the tested optic.
One of the interfering wavefronts is reflected from a nearly perfect reference surface. This could be the bottom of a test plate, or the beam splitter of a Fizeau interferometer. The other wavefront would be reflected from a surface under test, or it could be the result of transmission through an optic, then reflected back through it, from a nearly perfect mirror. In that case distortion to the wavefront would be a resultant of front and rear surface errors, plus any lack of homogeneity in the optic’s bulk material. Errors from the interferometer cavity are generally so small that they may be ignored. However, sophisticated systems can measure and store those errors, then subtract them from the test results. For either case there will be small variations in the optical path length of the test beam. Because the reference beam is as close to perfect as can be made, the interference pattern indicates irregularities in the test beam, including their magnitude.
Analysis of fringe patterns, the traditional evaluation method, characterizes curvature, spacing difference, and lack of parallelism, and compares it to a perfect pattern of evenly distributed lines. This will yield a useful value of peak-to-valley distortion. Some other information can be garnered, including slope and astigmatism. But a more thorough analysis requires more measured points and computer analysis. Spherical power, RMS, Zernike polynomial coefficients, Power Spectral Density (PSD), and other terms are available from typical analysis computers.
So, How Accurate is Interferometry?
An interferometer uses light to measure deviation from a near perfect reference. That deviation is usually expressed in fractions of a wave. A tenth wave error is readily detected. One twentieth of a wave sensitivity is common, and the best instruments are capable of much better than that.
How big is a wave, or a fraction of one? Modern interferometers use laser light to make the measurements. Helium neon lasers (HeNe) became the standard light source, based on availability, stable output, coherence length, and cost. Other lasers may be used, especially for transmitted wavefront measurements of a material which is not transparent to red visible light. Diode lasers are often replacing the old standby, the HeNe laser. Those generally have a wavelength close to the principal one of a HeNe laser, which is 632.8nm, a distinctive red familiar from checkout scanners and laser pointers. One tenth of that wavelength equals about 0.06 microns, equal to 2 ½ microinches. That is like splitting a hair into a thousand pieces. Easily “close enough for government work.” Not to mention, laser scientists and optical designers.
It is often said that you can only make things as good as you can measure them. Using light in an interferometer allows making optics very good indeed.
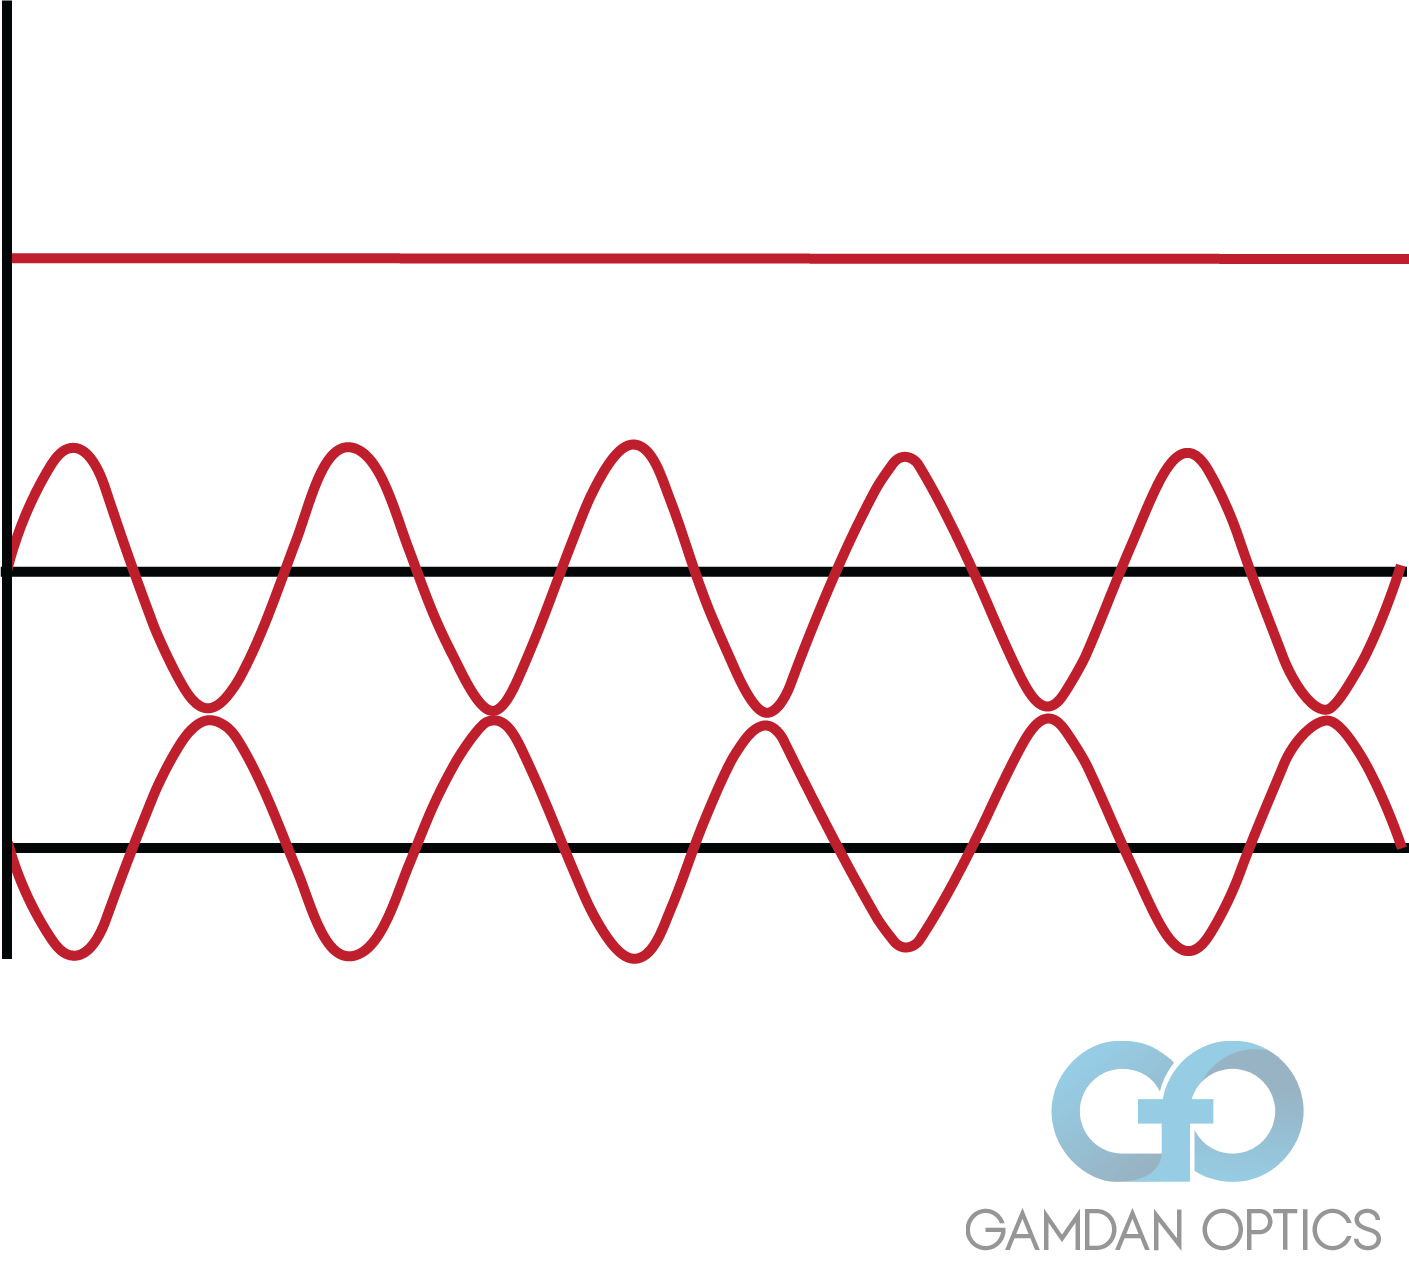
Fig. 2 The lower two red lines again show equal intensity, but out of phase by a half-wave , 180 degrees. The highs and lows add to zero, and the resultant wave appears above, a flat line.
How we can help
With absolute focus on the most demanding applications, GAMDAN Optics, Inc. has developed solutions specifically to excel in high peak and average power densities, deep into the UV. Contact us today to see if we can help with the development of your system.
DENNIS J. GARRITY, AUTHOR
Dennis is an engineer with over 45 years of experience in fabrication, testing, and material evaluation for high precision optics, with extensive hands-on experience. More on the author can be found here.